Friday, July 30, 2021

“When Choice Really Works, It Lifts Up Everyone”

Education Next senior editor Paul Peterson spoke with Robert Behning, chair of the house education committee in Indiana, about recently enacted legislation expanding the Indiana School Choice Scholarship program.

Paul Peterson: How many students are participating in this program, and how much is it expanding under the new legislation?

Robert Behning

Robert Behning: Today about 35,000 students statewide are in the program. We made dramatic changes this year, though. The first voucher bill in Indiana, in 2011, was means tested. For a family to be eligible, their income had to be no higher than [the maximum qualifying income for] free and reduced lunch, which at that time was about $40,000 for a family of four. What we did this year is lift that cap to 300 percent of free and reduced lunch, so a family of four with an income of $145,000 or less will now have access to school-choice scholarships.

Now Democrats in Indiana are complaining that this is too much, that families that make $145,000 a year don’t need the money to send their children to a private school, and that this initiative is just helping the rich at the expense of the poor. How do you respond to that?

That point came up in some of the debates. One of the things I reflected back to them during those debates was that Joe Biden is now president of the United States, and he has said that if you make less than $150,000, you are middle income, and you deserve a stimulus check. And I would argue that if the president—the president of their party, so to speak—argues that that is a middle income for Americans, then what we are doing in Indiana is implementing policy that he has advocated for. I would also argue that for choice to be successful, to have more opportunities for kids across the state, the program cannot be just in urban centers. It can’t be just for kids in poverty and failing schools. You need a robust choice environment to lift up everyone.

Are there new private schools opening up? How many private-school placements are available to students now?

We estimate that we have 12,000 to 15,000 seats available. We’ve made entry into the choice program relatively easy. A choice school can be either brick and mortar or virtual. I think we’re going to see a growth of choice schools in Indiana, now that there are more funds available. I’ve received a lot of letters and emails from individuals who have an interest in expanding and making more options available for kids. We also created an education savings account program for special-ed students.

What’s the charter school situation in Indiana? And why was that not expanded at the same time?

We have no caps on charters, and we have multiple authorizers. [Indiana was the first] state in the union to allow the mayor of a city to authorize, and the mayor of Indianapolis is an authorizer. We have a state charter board, and we’ve allowed both public and nonpublic universities to become authorized to charter. One of the dilemmas in the charter sector has been facility funding, so we have significantly increased that funding as well.

A lot of people say, though, that this all sounds good, but how about the kids being left behind in the public schools? Aren’t you raiding the public schools of their best students? Aren’t there extra resources that these schools need that are now being lost?

As I said earlier, I think that when choice really works, it lifts up everyone. And our data have demonstrated that. Indianapolis probably has the most choice options of all the communities in our state. They have the most charters per capita, and we’ve created other options for them. We have traditional charter schools, or legacy charters, and we’ve created an option called innovation network charters, which are charters that are located within traditional school buildings. [Both the traditional and the charter schools] have embraced competition, and academic performance overall has actually increased. When you get robust competition, you’ll find that it has uplifted everyone’s performance.

How did you get the Republican Party consolidated behind this, given that a lot of Republicans come from rural areas? I grew up in a small town, and I remember that everybody was enthusiastic about their local public school—the basketball team, the football team, the band, the orchestra. Are the rural legislators as enthusiastic about choice?

I would say there probably is a bit less enthusiasm among them, but I also think it takes leadership, and we’ve had some great leaders over the years who have helped paint the picture, or the vision. I don’t think it should be about either-or, but about both. So, you’re not necessarily tearing away at your traditional public schools. It’s about improving everybody’s opportunity.

The other side of that coin is that choice is available in cities more than anywhere else. And the demand is greater among minority families than any other families, in our polling. Why are Democrats so solidly against giving opportunities, especially to low-income students and other students who are attending schools that aren’t performing?

I would argue that that’s probably a reflection of their allegiance to the unions and the union power that has aligned with the Democratic Party.

Betsy DeVos, the U.S. secretary of education under President Trump, was severely criticized during her four years in office. Critics said she was a school-choice advocate and didn’t support the public schools—but maybe she deserves more credit. Do you think she created more interest in school choice by her constant advocacy?

I’ve known Betsy DeVos a long time, and I have a great deal of respect for her. Betsy is willing to put her money behind what she believes in. It’s easy for people to advocate spending other people’s money on a program, but when you put your own money behind it, I think it really shows your level of commitment. I think Betsy was criticized unfairly and that her focus was on uplifting all kids, trying to serve those kids who are most in need, and looking at urban centers where a lot of kids are struggling, failing, and dropping out of school. If school choice helps uplift them, then why not? I think that’s where Betsy was. She was committed to making sure that all students have the opportunity for a great teacher, a great school, and ultimately for success.

So, what do you see as the path forward? What’s the next step in school choice?

I think you’re going to find Covid has changed some of this—that education really needs to be more adaptable and more personalized. Education savings accounts give parents the ability to seek that personalization. Long-term, maybe it makes sense to increase the opportunities afforded by ESAs, because that would give families more options for customizing their children’s education in the future.

This is an edited excerpt from an Education Exchange podcast, which can be heard at educationnext.org.


Sign up for the Education Next Weekly to receive stories like this one in your inbox
.


The post “When Choice Really Works, It Lifts Up Everyone” appeared first on Education Next.

By: Education Next
Title: “When Choice Really Works, It Lifts Up Everyone”
Sourced From: www.educationnext.org/when-choice-really-works-it-lifts-up-everyone-indiana-robert-behning/?utm_source=%25E2%2580%259CWhen%2BChoice%2BReally%2BWorks%252C%2BIt%2BLifts%2BUp%2BEveryone%25E2%2580%259D&utm_medium=RSS&utm_campaign=RSS%2BReader
Published Date: Fri, 30 Jul 2021 09:00:22 +0000

News…. browse around here

Best Shortlink Creator

check this link right here now

Thursday, July 29, 2021

A Robust and Timely Discussion of a New Kind of Homeschooling

Hybrid Homeschooling: A Guide to the Future of Education
by Michael Q. McShane
Rowman & Littlefield, 2021, $60; 142 pages.

As reviewed by Michael B. Horn

Hybrid learning and homeschooling have become prominent models over the past school year as millions more students learned from home, whether part or full time, during the coronavirus pandemic.

Against that backdrop, Mike McShane’s new book, Hybrid Homeschooling, would seem both topical and timely.

It is both of those things, but not for reasons directly related to the pandemic or the various phenomena of blended and remote learning that became so widespread in much of the country beginning in March 2020.

McShane’s book is instead a treatment of a strand of homeschooling that has received relatively little attention: “hybrid homeschooling,” which he defines as “a school that for some part of the week educates children in a traditional brick-and-mortar building and for some other part of the week has children educated at home.”

At first glance, this concept might not seem to differ much from the enriched virtual-school models that have emerged over the past 15 years—schools in which students learn in person for a portion of the week and remotely online for another part of the week—or even schools in which students learn in person five days a week and learn at home during off hours. The big difference, McShane writes, lies in the definition of homeschooling, Hybrid homeschoolers have an education that is at least “partially controlled by parents, is partially provided by their parents, and takes place in the home for part of the school week. . . . The arrangement must meet three criteria: physical, regular, and substantial.”

The book serves ultimately as a survey-level primer on this phenomenon, which is an important one to understand because hybrid homeschooling may make homeschooling and school choice more accessible to millions of families in the years ahead. As McShane documents, prior to the pandemic, 10 percent of parents indicated a desire to home-school their children “if money or logistics” were no object. According to a February 2021 survey by EdChoice, where McShane is director of national research, 44 percent of parents would prefer a mix of home- and school-based education in the future—and, assuming hybrid homeschooling is available, parents in the original 10 percent are more likely to find a way to continue to home-school in the years ahead.

McShane leads into his primer with a brief but comprehensive summary of the research and the state of homeschooling more generally. As he documents, homeschooling has been on the rise since 1970, when “there were fewer than fifteen thousand homeschool students throughout the United States.”

Since then, he argues, it’s come “roaring back,” which is hard to dispute given that in 2016, according to the National Center for Education Statistics, 1.69 million students—or 3.3 percent of the schooling population—were home-schooled, up from 850,000 in 1999.

First grader Jaion Pollard arrives at Manchester Academic Charter School in Pittsburgh on the first day of in-person learning on a hybrid schedule, March 29, 2021.

What McShane doesn’t mention is that the NCES estimate peaked at 1.773 million in 2012. Granted, the data are weak on the true numbers of students who are home-schooled, because of the wide variability in state policy relating to the practice—which McShane does a good job of summarizing—yet it seems clear that prior to the pandemic, the growth of homeschooling had plateaued. Although McShane shows evidence based on state-level data that the numbers may have started to rise again into 2019, homeschooling hadn’t been growing nearly as fast as its advocates like to assert.

Then again, what makes hybrid homeschooling so intriguing is its potential to make homeschooling more accessible to families by, for example, reducing costs or eliminating parents’ logistical challenges around childcare.

After reviewing studies on the effects of homeschooling and considering the views of its detractors, McShane concludes that it’s not possible to assert that homeschooling has a positive effect on academic achievement or social development, but it’s also clear that students who are home-schooled “run little risk of academic or social harm.”

The book provides a series of compelling case studies of families and educators who have made the leap into hybrid homeschooling. Each chapter begins with a story that illustrates a particular aspect of homeschooling and chronicles the experiences of parents, families, educators, and regulators. These stories serve to humanize the sometimes wonky details that McShane explores throughout.

There’s the story, for example, of a family whose children are enrolled in the Classical Christian Conservatory of Alexandria, Virginia, where the mother, Kristin Forner, is on the front lines of fighting Covid-19 as an anesthesiologist and palliative-care physician.

Forner told McShane that “we are not a typical homeschooling family,” as both she and her husband were educated in public schools and were not particularly excited about homeschooling at first. But they were drawn to the model because they wanted a classical, Christian education for their children, and there weren’t many schooling options around that fit the bill. When they realized they could afford the conservatory and that their children would learn at home two days a week, the benefits became clearer: quality time with their children, more time for creative play, greater transparency into what their children were learning, and the opportunity to teach controversial subjects on their own terms.

What emerges from the stories is an empathetic portrait of the individuals who choose to engage in hybrid homeschooling—and a realization of how diverse those individuals are.

McShane argues that families choose hybrid homeschooling for four primary reasons: the gift of time, personalization, being involved together in education, and mental health.

As for educators, they choose to participate in hybrid models for many of the same reasons, but also to create a stronger community than they could in a public school. That said, McShane describes the drawbacks to teaching in a hybrid homeschool environment—compensation chief among them—that for now will likely limit the numbers of educators who can commit to such schools.

Photo of Michael Q. McShane
Michael Q. McShane

One of the most interesting chapters provides a summary of policy on homeschooling. The chapter covers the various ways in which states treat homeschoolers and the challenges, inherent in models that aren’t built around seat time, of circumventing time-based Carnegie Unit requirements. It also highlights the opportunities to innovate that hybrid homeschooling affords public-school leaders when they choose to participate rather than fight those who opt for homeschooling. The public-school educators McShane chronicles come across as cage busters redefining the educational experience in positive ways. Kentucky’s superintendent of the year, Brian Creasman, from Fleming County Schools, for example, seized the opportunity to enroll hybrid homeschoolers in mastery-based programs and at last take advantage of the state regulations that waive the Carnegie Unit—regulations that were “staring at us in the face.”

Where the book most misses the mark is in the innovation chapter, which feels forced and a bit too academic. The discussion of design thinking in hybrid homeschooling isn’t so much wrong as it is stilted and too brief to resonate. And the use of Everett Rogers’s diffusion-of-innovation curve—a model that attempts to show the rate at which new ideas and technologies spread—feels premature at best. As a whole, the chapter reads like a needless add-on to an otherwise robust discussion of the growing hybrid-homeschooling phenomenon.

I would have preferred to see McShane explore how the funders that are looking for ways to reinvent schooling through entrepreneurship and innovation might exploit—or perhaps already are exploiting—hybrid homeschooling to help produce larger-scale changes in the aftermath of the pandemic. For funders looking for ideas, there are plenty of inspiring innovators and entrepreneurs in this book who may hold the keys to a bigger rethinking of how education has to work in this country. McShane’s volume is a great place to start.

Michael Horn is an executive editor of Education Next, co-founder of and a distinguished fellow at the Clayton Christensen Institute for Disruptive Innovation, and a senior strategist at Guild Education.


Sign up for the Education Next Weekly to receive stories like this one in your inbox
.


The post A Robust and Timely Discussion of a New Kind of Homeschooling appeared first on Education Next.

By: Michael B. Horn
Title: A Robust and Timely Discussion of a New Kind of Homeschooling
Sourced From: www.educationnext.org/robust-timely-discussion-new-kind-homeschooling-hybrid-homeschooling-mcshane-book-review/?utm_source=A%2BRobust%2Band%2BTimely%2BDiscussion%2Bof%2Ba%2BNew%2BKind%2Bof%2BHomeschooling&utm_medium=RSS&utm_campaign=RSS%2BReader
Published Date: Thu, 29 Jul 2021 09:00:11 +0000

News…. browse around here

Best Shortlink Creator

check out your url

Wednesday, July 28, 2021

The Fix Is In

The Quick Fix: Why Fad Psychology Can’t Cure Our Social Ills
by Jesse Singal
Farrar, Straus and Giroux, 2021, $28; 352 pages.

As reviewed by Jay P. Greene

Jesse Singal’s new book, The Quick Fix, is an impressive display of social-science journalism. Singal manages to describe complicated and technical issues accurately and with nuance, a feat rarely achieved by researchers, let alone journalists. The book focuses on six niches of social-science study that over the past few decades have had widespread influence on policies and practices beyond the narrow confines of academia. He takes on the self-esteem movement, the “superpredator” theory in criminology, the use of “power posing,” positive psychology, grit, and the implicit association test for unconscious racial bias.

It would be too strong to say that Singal “debunks” the findings that drew attention to these six topics, but he does critique them and is particularly skeptical of claims that interventions or policies generated from these areas of study have the potential to significantly alter outcomes in real-world settings. He acknowledges the extent to which research supports such claims but points out the limited quality of that research, asserting that it is often so contingent on specific contexts that it does not apply more broadly.

For example, in the chapter on self-esteem, Singal discusses Carol Dweck’s ideas about growth mindset, the belief that academic performance can be altered through personal effort. He acknowledges that a large randomized experiment published in Nature by Dweck and two dozen co-authors found that a “mindset intervention . . . does appear to have some effects. . . . If this research holds, it could be argued that mindset interventions do offer a minor but legitimate boost to a subset of otherwise academically vulnerable students—a boost that is at least somewhat related to self-esteem.” His critique is not that self-esteem ideas are fundamentally mistaken, but that they have been grossly oversold and misapplied in contexts well beyond what can be supported by rigorous research.

Singal similarly concedes that a positive-psychology intervention, the Penn Resilience Program, or PRP, has had positive results: a study “found that while the PRP did appear to reduce depressive symptoms among students exposed to it, those reductions were small, statistically speaking.” In the chapter on grit, Singal notes that “both conscientiousness and grit do appear to be correlated with school performance—somewhat.” And in the chapter on the implicit association test, or IAT, to measure unconscious racial bias, Singal writes “there does appear to be a statistically significant correlation between IAT scores and behavior observed in studies; it’s just so small as to likely be meaningless in the real world.” Singal expresses plenty of reservations about how robust all of these research findings are, but he does not accuse their proponents of manufacturing false results. His real concern is about the use of these findings to attempt to shape and improve individual behavior in any meaningful way, especially on a mass scale.

If the main problem that Singal is identifying is one of overhyping and misapplying social-science research, it is unclear how much of the responsibility lies with researchers or others. Singal is inclined to place a fair amount of the blame on the researchers, who are drawn by the attention and resources that overhyped research can generate. This view does not seem entirely fair, given the extent to which politicians, foundations, reporters, and the general public are willing to lavish attention and resources on whichever researchers will confidently claim that they have consulted with the oracle of social science and divined guidance for how we should structure policy and live our lives. Education reform has especially suffered from this cultlike devotion to claims generated by social science, ignoring the glaring weakness of most social-science research while dismissing the useful insights of wisdom and experience.

Photo of Jesse Singal
Jesse Singal

The corruptibility of researchers is a problem, but that’s only part of the story—especially because in several chapters we learn that the researchers recanted their findings or otherwise attempted to temper misuse of their work. For example, in the chapter critiquing the 1990s-era claim that the country was facing an alarming rise in superpredator criminals, Singal notes that the main proponents of that theory later abandoned their claims, even authoring a U.S. Supreme Court amicus brief to rebut them. In the chapter on “power posing” as a strategy for advancing women’s careers, Singal reveals that one of the authors of the original study later posted a statement on her faculty website, underlined and in bold, saying, “I do not believe that ‘power pose’ effects are real.” In the chapter on enhancing grit to improve student success, Singal concedes that Angela Duckworth, who developed the concept, tried but failed to contain the misuse of her findings: “To her credit, Duckworth has been significantly more candid and transparent than other researchers who have found their ideas under scrutiny, and she has been generally open about the limitations of the research. . . . Duckworth has expressed frustration at the fact that she had, to a certain extent, lost control of the grit narrative.”

There is a larger story here, which Singal does not fully develop, about why we as a society invest an unreasonable amount of authority in social science. He hints at this in his concluding chapters about the implausibility that priming, nudges, and other subtle interventions have large and predictable effects on human behavior, given how complicated and deeply rooted our motivations likely are. But he doesn’t seem to see the problem as inherent in our overreliance on social science as a guide for life. He seems to think that if only researchers preregister their studies and exercise greater care, we can avoid these abuses. He favorably quotes “the champion of replication and transparency in psychological science,” Brian Nosek, who writes that reformers have “irrevocably altered the norms and accelerated adoption of behaviors like preregistration and data sharing. Thanks to them, psychological science is in a different place today than it was in 2011. Psychology in 2031 is going to be amazing.” Singal’s cautious agreement with this optimism strikes me as naïve, especially given all of the abuses he so carefully documents in his book.

Singal accurately captures the nuance and detailed shortcomings of research but seems to struggle in discussing the bigger picture with similar skepticism. The heart of the book lies in the chapters, some of which Singal published previously as standalone articles, about the weakness and misuse of particular research claims. In cobbling this material together into a book, Singal may not have given priority to identifying the unifying themes of his chapters. A plausible conclusion he could have drawn is that while social science can shed light on human behavior and even help guide it, it is not the only or necessarily the most reliable source of wisdom on how to live our lives. That’s also what the great religious traditions and their deference to experience and past practice are about. The Enlightenment values that gave rise to the social sciences can supplement the ancient teachings but need not replace them. Given how careful Singal is, perhaps he did not want to make an overly strong argument about unifying themes for fear of extending beyond his evidence, which is reasonable but makes the volume as a whole a little less compelling than it might have been.

Jay P. Greene is a senior research fellow at the Heritage Foundation.


Sign up for the Education Next Weekly to receive stories like this one in your inbox
.


The post The Fix Is In appeared first on Education Next.

By: Jay P. Greene
Title: The Fix Is In
Sourced From: www.educationnext.org/fix-is-in-skeptical-look-at-oracle-social-sciences-quick-fix-singal-book-review/?utm_source=The%2BFix%2BIs%2BIn&utm_medium=RSS&utm_campaign=RSS%2BReader
Published Date: Wed, 28 Jul 2021 09:00:46 +0000

News…. browse around here

Best Shortlink Creator

check here

Tuesday, July 27, 2021

Proving the School-to-Prison Pipeline

This spring, the Biden administration announced it would seek public comment on student race and school climate, which was roundly viewed as a precursor to restoring an Obama-era directive to reduce racial disparities in discipline practices. Those guidelines, which were rescinded by former Secretary Betsy DeVos, have been variously described as a critical means of protecting students’ civil rights and a dangerous overreach by the federal government that prevented schools from keeping students safe.

At issue is the school-to-prison pipeline—a term often used to describe the connection between exclusionary punishments like suspensions and expulsions and involvement in the criminal justice system. Black and Hispanic students are far more likely than white students to be suspended or expelled, and Black and Hispanic Americans are disproportionately represented in the nation’s prisons.

Is there a causal link between experiencing strict school discipline as a student and being arrested or incarcerated as an adult? Research shows that completing more years of school reduces subsequent criminal activity, as does enrolling in a higher-quality school and graduating from high school. Yet there is little evidence on the mechanisms by which a school can have a long-run influence on criminal activity.

To address this, we examine middle-school suspension rates in Charlotte-Mecklenburg Schools, where a large and sudden change in school-enrollment boundary lines resulted in half of all students changing schools in a single year. We estimate a school’s disciplinary strictness based on its suspension rates before the change and use this natural experiment to identify how attending a stricter school influences criminal activity in adulthood.

Our analysis shows that young adolescents who attend schools with high suspension rates are substantially more likely to be arrested and jailed as adults. These long-term, negative impacts in adulthood apply across a school’s population, not just to students who are suspended during their school years.

Students assigned to middle schools that are one standard deviation stricter—equivalent to being at the 84th percentile of strictness versus the mean—are 3.2 percentage points more likely to have ever been arrested and 2.5 percentage points more likely to have ever been incarcerated as adults. They also are 1.7 percentage points more likely to drop out of high school and 2.4 percentage points less likely to attend a 4-year college. These impacts are much larger for Black and Hispanic male students.

We also find that principals, who have considerable discretion in meting out school discipline, are the major driver of differences in the number of suspensions from one school to the next. In tracking the movements of principals across schools, we see that principals’ effects on suspensions in one school predicts their effects on suspensions at another.

Our findings show that early censure of school misbehavior causes increases in adult crime—that there is, in fact, a school-to-prison pipeline. Further, we find that the negative impacts from strict disciplinary environments are largest for minorities and males, suggesting that suspension policies expand preexisting gaps in educational attainment and incarceration. We do see some limited evidence of positive effects on the academic achievement of white male students, which highlights the potential to increase the achievement of some subgroups by removing disruptive peers. However, any effort to maintain safe and orderly school climates must take into account the clear and negative consequences of exclusionary discipline practices for young students, and especially young students of color, which last well into adulthood.

Desegregation in Charlotte-Mecklenburg

For decades, school enrollment and bus routes in the Charlotte-Mecklenburg school district were designed to achieve racial integration. The busing plan was ordered by a state judge and upheld by a unanimous U.S. Supreme Court decision in 1971, after the Swann family, who were Black, sued to reassign their 6-year-old son from an all-Black school to an integrated school closer to their home. The landmark Swann v. Charlotte-Mecklenburg Board of Education decision required the district to reassign students to new schools to balance their racial composition and influenced similar busing programs nationwide.

It was another parent lawsuit that ultimately ended mandatory busing and redrew school-zone boundaries in Charlotte-Mecklenburg again. In 1997, a white parent named William Capacchione sued the district because he believed his child was denied entrance to a magnet program based on race. This case led to a series of court battles that ended with a 2001 ruling by the Fourth Circuit Court of Appeals, which upheld an earlier state court order to stop using race in school assignments. The district had “eliminated, to the extent practicable, the vestiges of past discrimination in the traditional areas of school operations,” the court ruled.

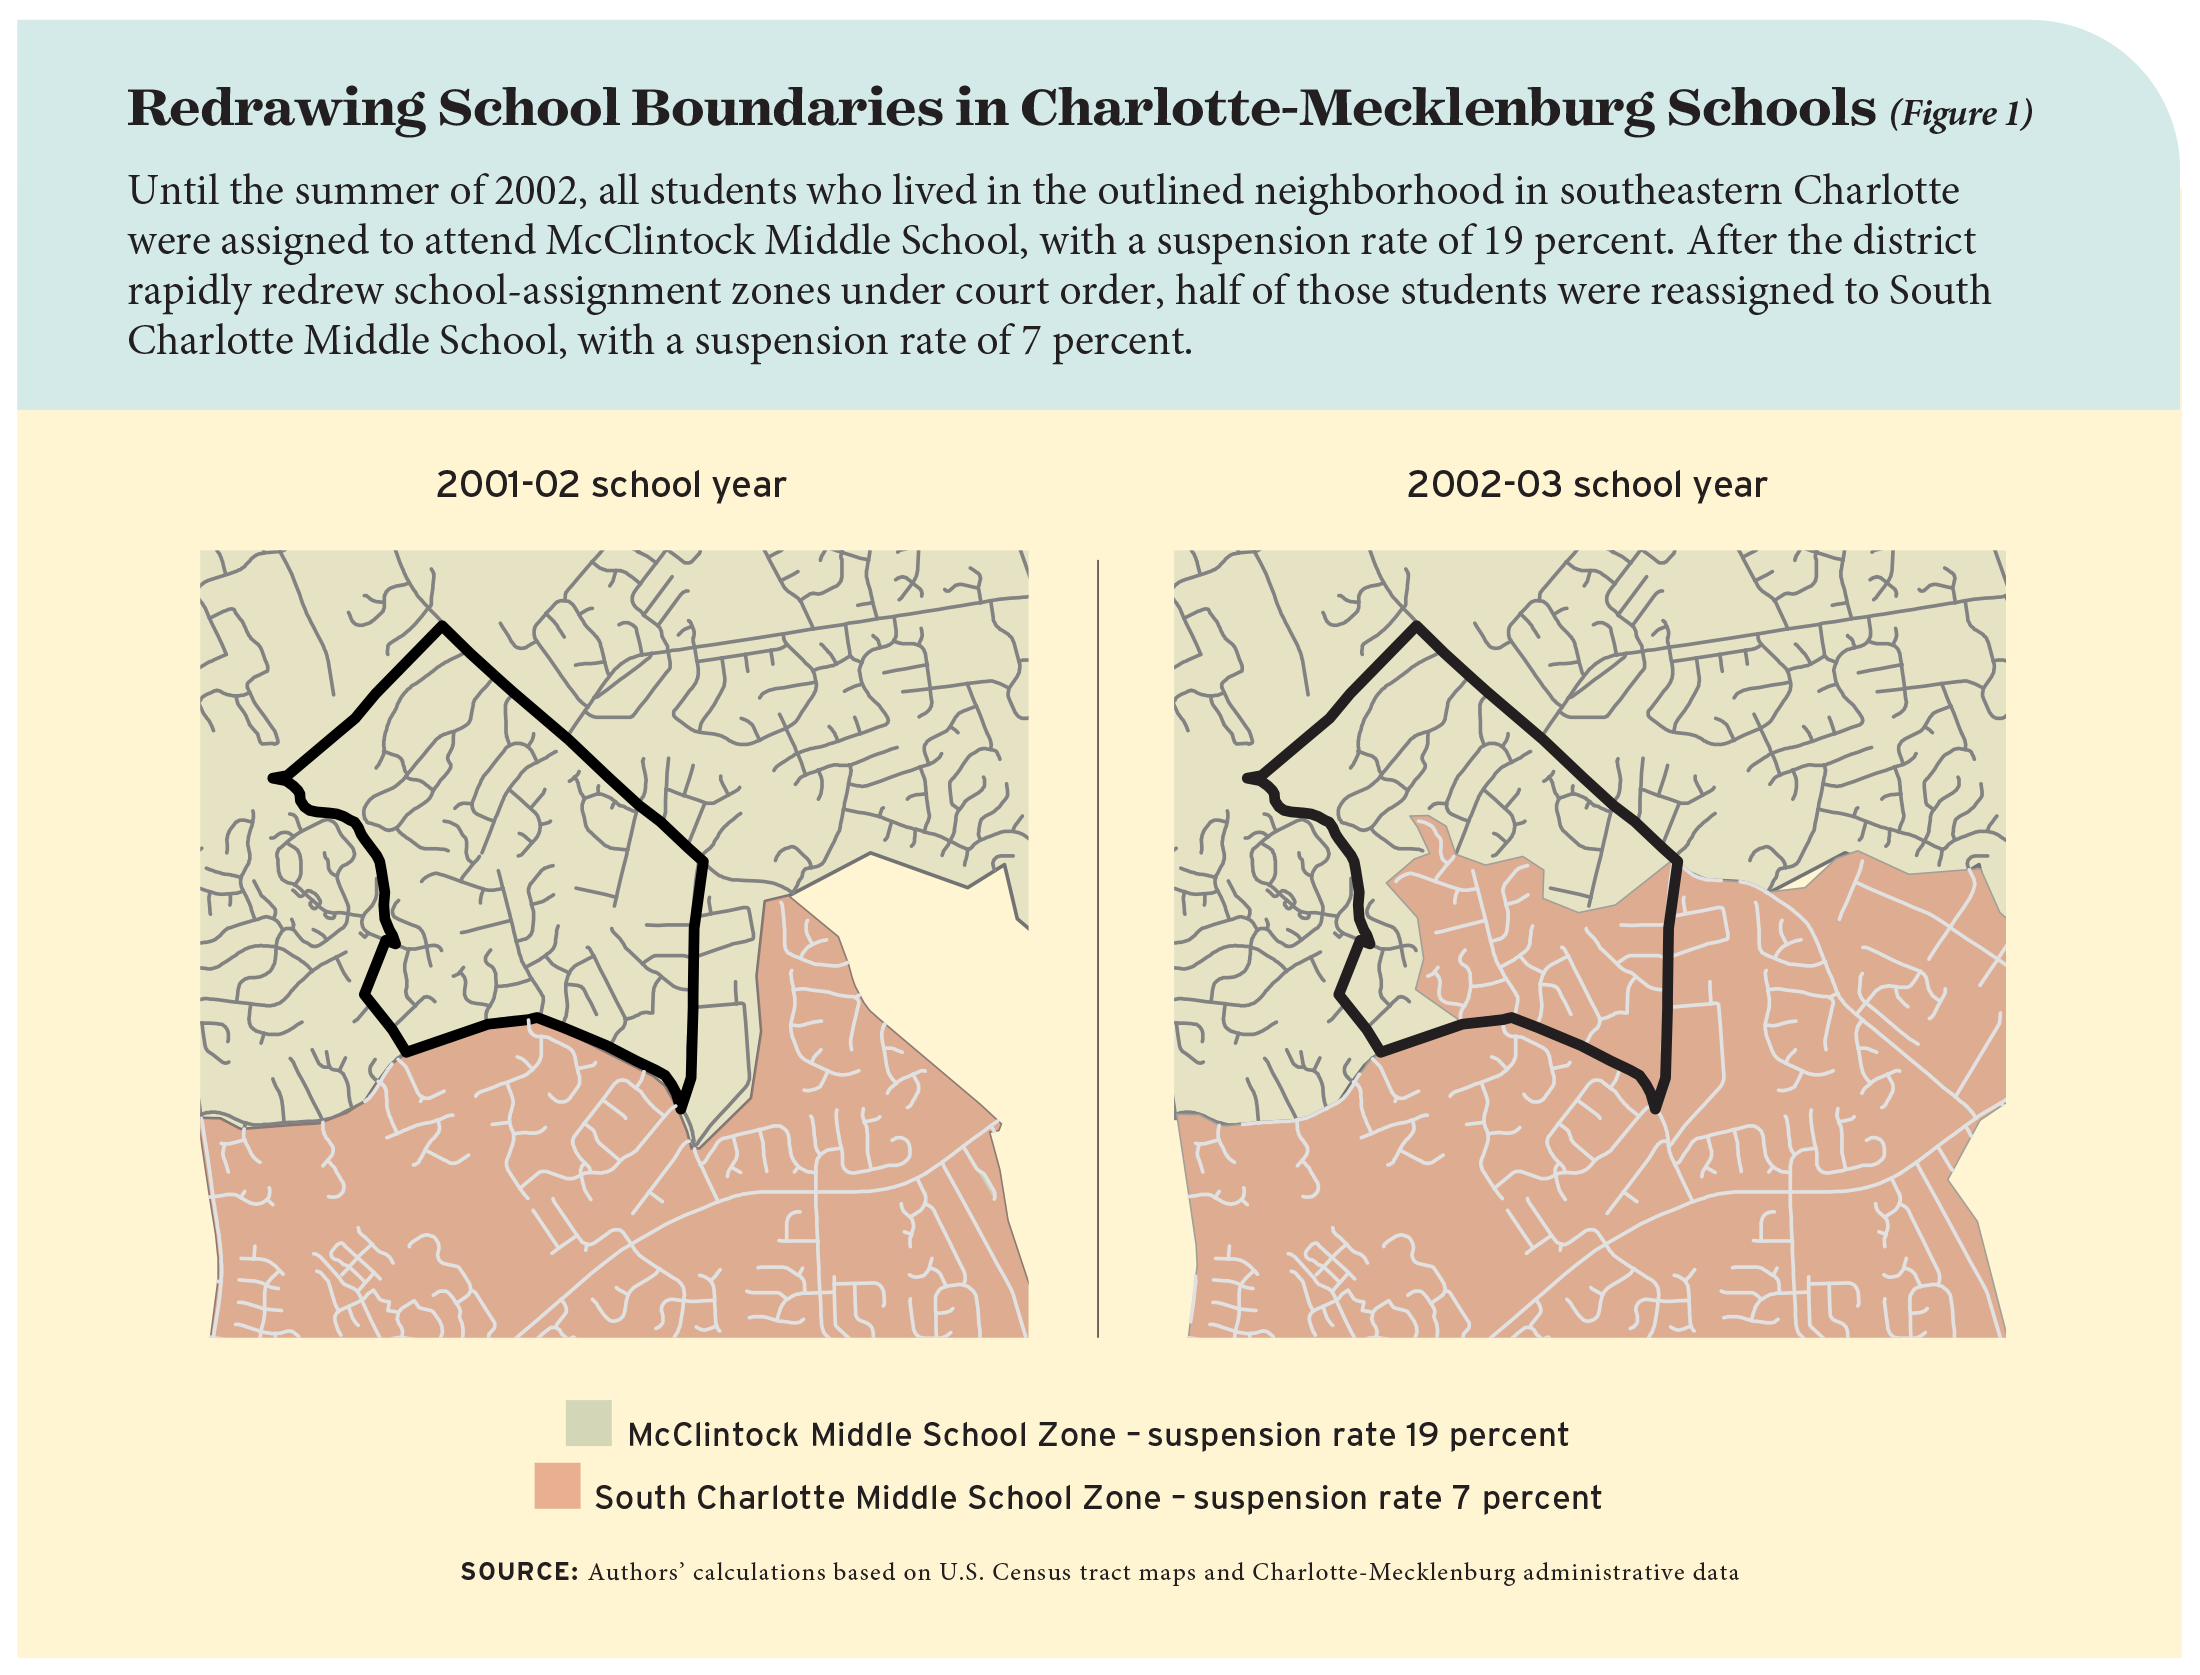
As a result, over the summer of 2002, Charlotte-Mecklenburg Schools redrew school-attendance boundaries based only on classroom capacity and the geographical concentration of students around a building. This mechanical redistricting process rarely took advantage of environmental features such as streams and major roads, and was controversial because it often bisected existing neighborhoods. About half of all students changed schools between 2001–02 and 2002–03.

For some students, that meant going from a school where suspensions were relatively rare to a school with a different approach to discipline (see Figure 1 for an example). While all schools are held to the district’s code of conduct and guidance by the North Carolina Department of Education, different schools have higher or lower rates of suspensions and expulsions.

Many discussions about the school-to-prison pipeline center on the possibility that students experiencing suspension differ from other students in ways that could explain their higher levels of involvement in the criminal justice system later in life. The sudden reassignment of half of all Charlotte-Mecklenburg Schools students in the summer of 2002 meant that students who live in the same neighborhoods and previously attended the same school could be assigned to attend very different schools in the fall. This creates a natural experiment to identify the impact of a school’s approach to discipline, which we use to identify a school’s influence on a range of outcomes in adulthood, including educational attainment and criminal activity.

Figure 1: Redrawing School Boundaries in Charlotte-Mecklenburg Schools

A Natural Experiment

Our analysis focuses on 26,246 middle-school students who experienced the boundary change because they were enrolled in a Charlotte-Mecklenburg school in both the 2001–02 and 2002–03 school years. We use district administrative records that track students from 1998–99 through 2010–11. The data include information on student demographics, test scores for grades 3 through 8 in math and reading, and annual counts of days suspended. Overall, 48 percent of students are Black, 39 percent are white, and 8 percent are Hispanic. On average, 23 percent of students are suspended at least once per school year, and the average suspension duration is 2.3 days.

District records also include each student’s home address in every year, which we use to determine individual school assignments under the busing and post-busing regimes. To define residential neighborhood, we use the 371 block groups from the 2000 Census that include at least one Charlotte-Mecklenburg student. We use address records to assign students to these neighborhoods and to middle-school zones for both the pre- and post-2002 boundaries.

To look at long-term outcomes, we first match district records to Mecklenburg County administrative data for all adult arrests and incarcerations from 1998 through 2013. Sixth graders in 2002–03 who progress through school as expected would enter 12th grade in the 2008–09 school year. Because our data on crime extends through 2013, we use two main measures of criminal activity: whether the individual was arrested between the ages of 16 and 21 and whether the individual was incarcerated between the ages of 16 and 21. This allows us to observe crime outcomes for all students who were in grades 6 through 8 in 2002–03.

We also track college-going data from the National Student Clearinghouse. That includes records for every student of college age who had ever attended a Charlotte-Mecklenburg school, including students who transfer to other districts or private schools or who drop out of school altogether. Because our data end in the summer of 2009, we cannot examine longer-run measures of educational attainment such as degree completion. Thus we focus on 7th- and 8th-grade students and measure whether they attended college within 12 months of the fall after their expected high-school graduation date.

Approximately 12 percent of our sample eventually drops out of high school, while 23 percent attend a 4-year college within 12 months of their expected graduation date. Between the ages of 16 and 21 years old, 19 percent are arrested at least once and 13 percent are incarcerated at least once. While well above the national averages in terms of suspensions and crime, Charlotte-Mecklenburg Schools is fairly representative of large, urban school districts in the Southern United States.

The Impacts of a Strict School

To quantify each school’s strictness, we use the same basic method commonly used to estimate individual teachers’ value-added to student test scores. We examine the number of days students are suspended both in and out of school to calculate strictness, while controlling for student characteristics such as test scores, race, gender, special-education status, and limited-English proficiency status, among others. This produces an estimate of each school’s predicted impact on suspensions based on how frequently it had suspended students in previous years.

We find that an increase of one standard deviation in school strictness expands the likelihood of being suspended in a given school year by 1.7 percentage points, or 7 percent. The average annual number of days suspended per year grows by 0.38, a 16 percent increase.

How does this affect student outcomes later in life? We look at criminal activity throughout Mecklenburg County and find that students who attend a stricter school are more likely to be arrested and incarcerated between the ages of 16 and 21.

Students assigned a school that is one standard deviation more strict are 17 percent more likely to be arrested and 20 percent more likely to go to jail, based on our estimated increases of about 3.2 percentage points for arrests and 2.5 percentage points for incarcerations. In looking at what types of crimes are involved, we find that school strictness increases later involvement in crimes related to illegal drugs, fraud, arson, and burglary, but not in serious violent crimes like murder, manslaughter, rape, robbery, and aggravated assault.

We also look at the impact on student academic performance and educational attainment and find no evidence that school strictness affects overall achievement. Because we measure the net effect across all students in a school, this may be due to a balancing of two opposing forces: negative effects of lost instructional time for those students who were suspended and positive effects of reduced number of disruptive peers in the classroom for students who were not.

However, we do find evidence that suspensions negatively affect educational attainment. A one standard deviation stricter school increases the likelihood that a student drops out of high school by 1.7 percentage points, or 15 percent, and decreases the likelihood of attending a 4-year college by 2.4 percentage points, or 11 percent.

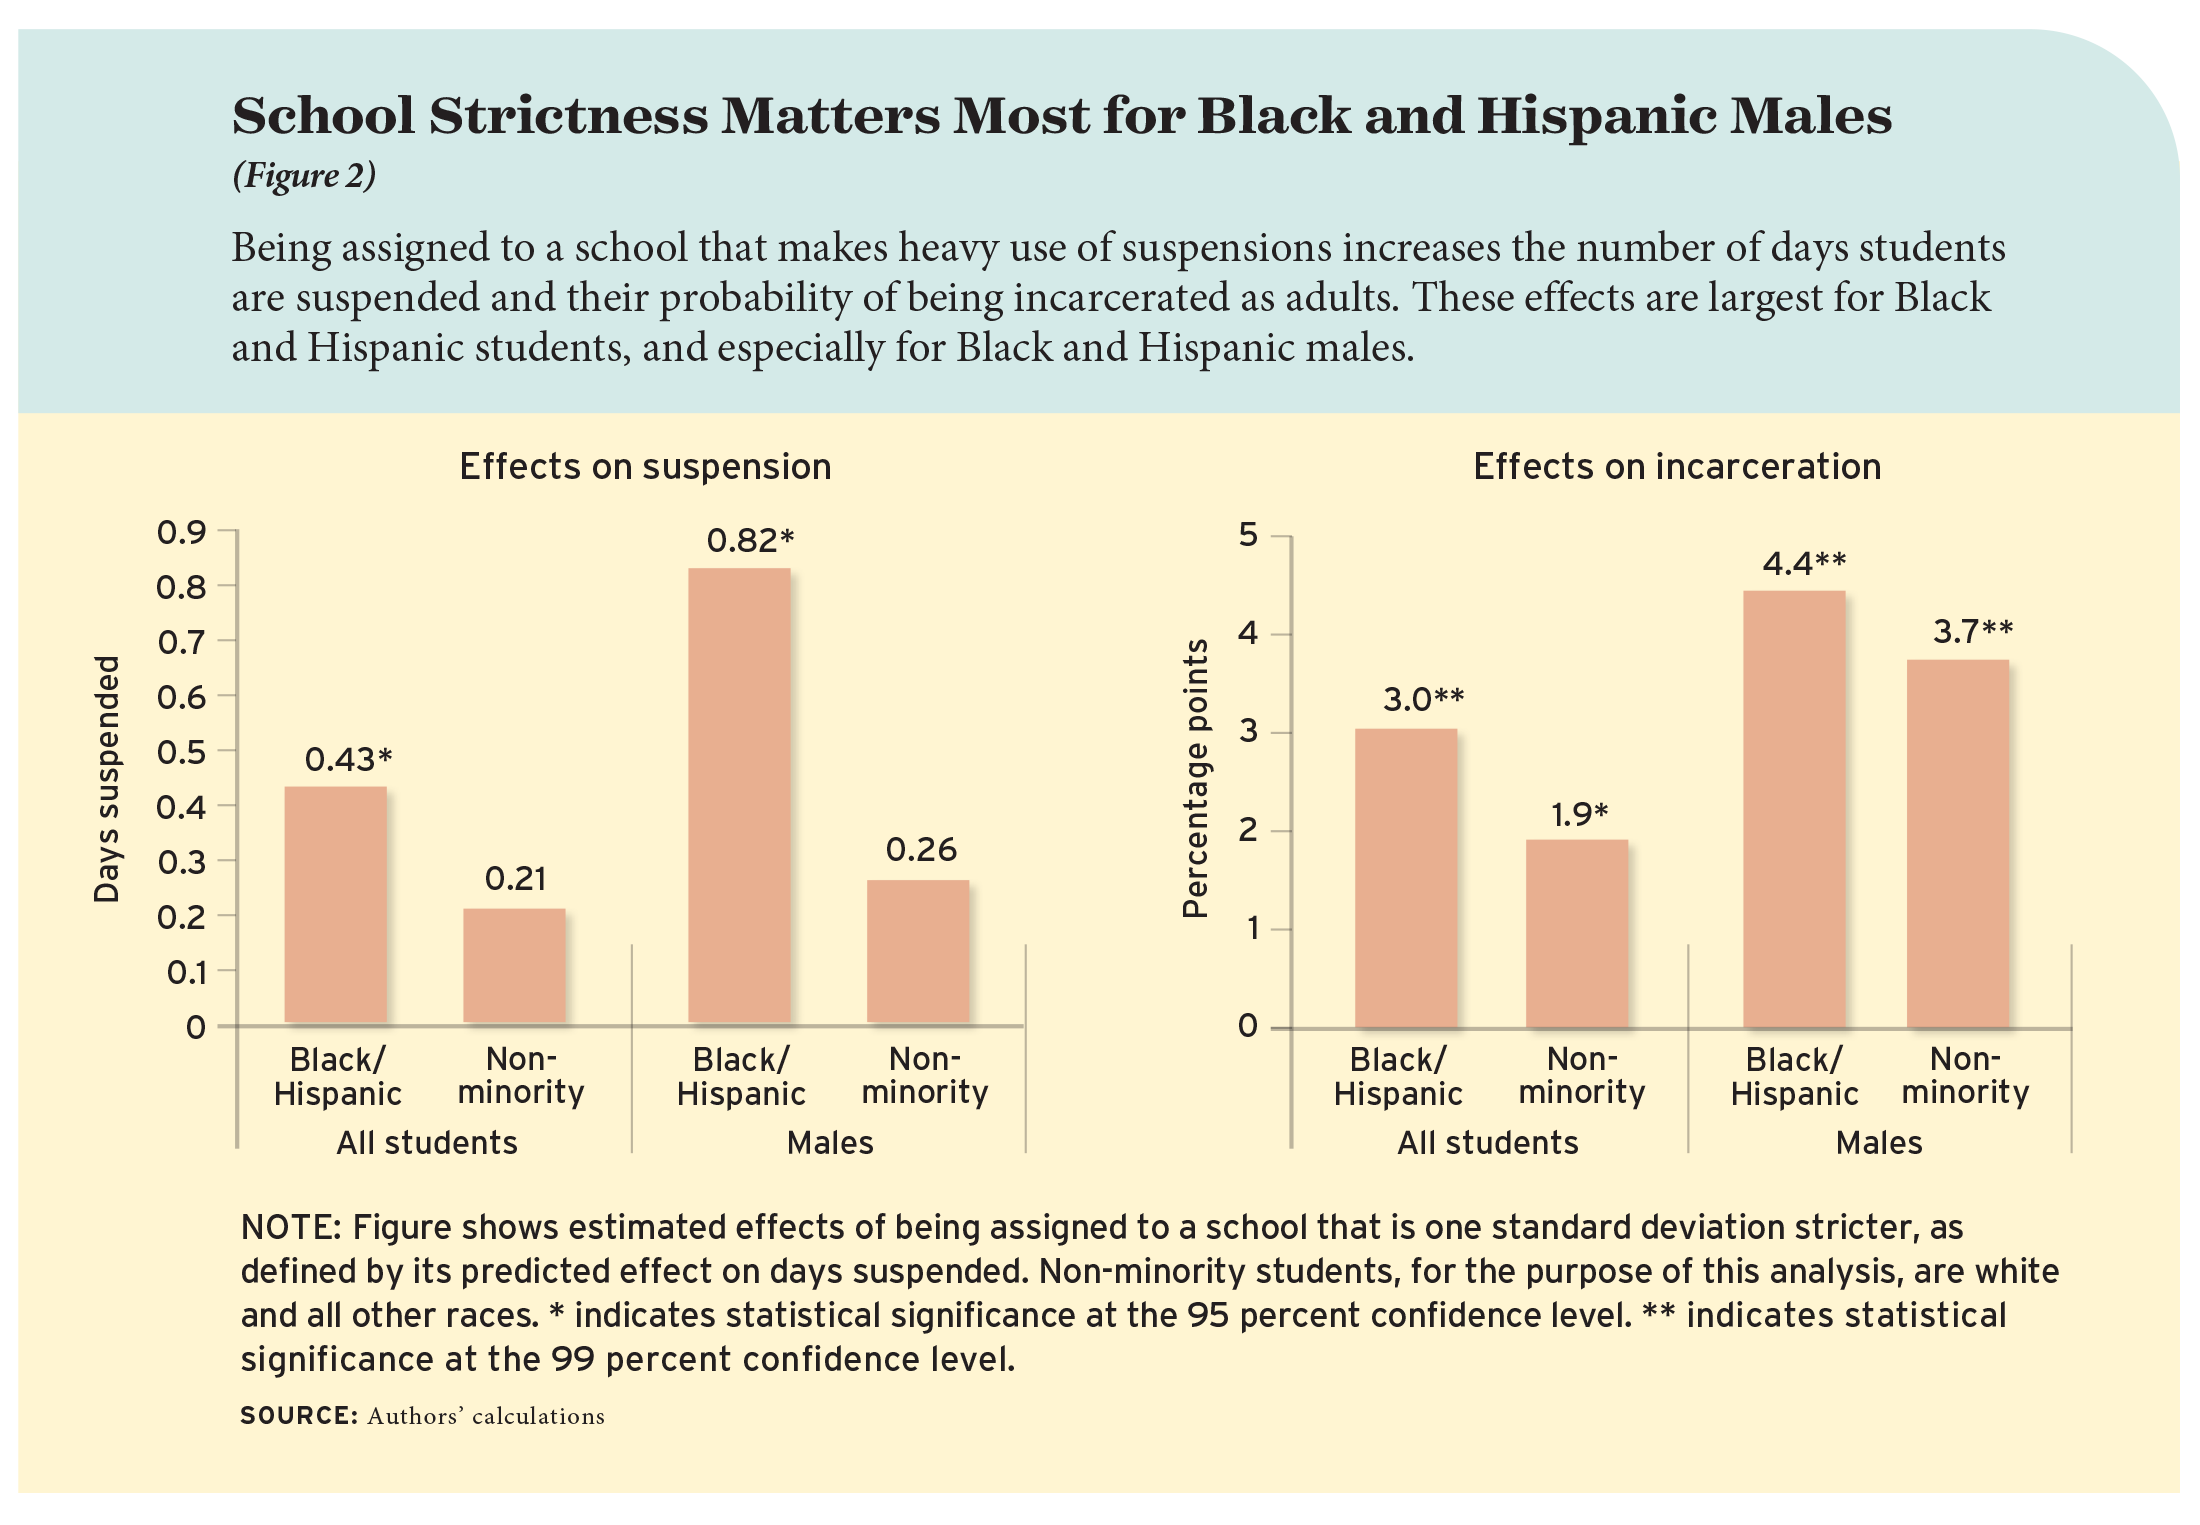
We then compare effects by race and find outsized impacts for Black and Hispanic students. Being assigned to a school that is one standard deviation more strict increases the average number of days suspended each school year by 0.43 for Black and Hispanic students compared to 0.21 days for non-minority students. That number is even larger for Black and Hispanic males, who are suspended 0.82 more days each year, on average—more than three times the effect for non-minority males.

As adults, Black and Hispanic students assigned to stricter schools are more likely to be arrested and incarcerated than their non-minority classmates. A one standard deviation stricter school increases the likelihood of being arrested by 3.9 percentage points for Black and Hispanic students compared to 2.7 percentage points for non-minority students (see Figure 2). The effect on incarceration in adulthood is 3.1 percentage points for Black and Hispanic students compared to 1.9 percentage points for non-minority students. Negative effects are especially pronounced among Black and Hispanic male students, who are 5.4 percentage points more likely to be arrested and 4.4 percentage points more likely to be incarcerated as adults.

While the average impact of a strict school across all students is negative, we do find small positive impacts on academic achievement for white male students. White male students who are assigned a school that is one standard deviation stricter score about 0.06 standard deviations higher on middle-school math and reading tests. This is consistent with prior studies that show positive short-run academic benefits to some students from removing disruptive peers from the classroom. However, we find no long-run impact on educational attainment for white males, who also experience substantial increases in adult arrests and incarcerations of 4.9 and 3.7 percentage points, respectively.

Figure 2: School Strictness Matters Most for Black and Hispanic Males

What Drives School Strictness?

We investigate three potential factors driving differences in school strictness. First, we look at the potential role of school peers. Prior research has found that peers are important contributors to students’ educational experiences, but we find little relationship between school strictness and peer characteristics, suggesting that our results are not driven by changes in peer composition.

Second, we test our main school strictness results alongside two other measures of school effects, based on student-achievement gains and teacher turnover. We find that disciplinary strictness is the only predictor of students’ later involvement in the criminal-justice system. This serves as further evidence that our results are driven by school effects on suspensions rather than other aspects of school quality or simply the disruption caused by sudden changes in enrollment patterns.

Finally, we turn to the role of school leaders, who have considerable discretion in how they handle disciplinary action. Principals have the authority to set parental meetings, after-school interventions, and in-school suspensions. Even the process for short-term out-of-school suspension is almost completely up to school leaders in Charlotte-Mecklenburg; the superintendent’s approval is only required for long-term suspensions of 11 days or more. We look at the movements of principals across schools and find that when a principal who has been strict in prior years switches into a new school, suspensions in the new school increase. This suggests that school effects on suspensions are driven by leadership decisions.

These findings echo the public’s anecdotal understanding of the strong role that principals play in establishing school climate and discipline. Consider Charlotte-Mecklenburg’s recent approach to limiting suspensions among young elementary-school students. Suspending very young students has come under public criticism across the country, with policymakers in New York City, Colorado, and New Jersey weighing moratoriums on the practice. The Charlotte-Mecklenburg school board considered a moratorium but opted to limit principal discretion instead and now requires the superintendent’s approval. In 2017–18, the first year of the new policy, the number of suspensions for K–2 students fell by 90 percent.

Implications

Misbehaving peers can have strong negative impacts on other students in the classroom, and all students need a safe, predictable, and peaceful environment to thrive. But our findings show that the school-to-prison pipeline is real and poses substantial risks for students in strict school environments. On average, students who attend middle schools that rely heavily on suspensions are at greater risk of being arrested and incarcerated as young adults and less likely to graduate from high school and go to college. Further, these effects are most pronounced for Black and Hispanic males, who are dramatically underrepresented among college graduates and overrepresented in the nation’s prison system.

This raises a critical question for policymakers and educators who enforce strict school discipline: for whom are our schools safe? And it establishes an opportunity for principals and organizations that support school leadership to weigh the tradeoffs between strict discipline practices and longer-term outcomes for students. As the nation continues to grapple with questions about racial equity and police reform, the contributing causal role that school-discipline practices play in raising the risk of criminality in adulthood cannot be ignored.

Andrew Bacher-Hicks is assistant professor of education at Boston University. Stephen B. Billings is associate professor at the University of Colorado Boulder. David J. Deming is professor at the Harvard Kennedy School and Harvard Graduate School of Education.


Sign up for the Education Next Weekly to receive stories like this one in your inbox
.


The post Proving the School-to-Prison Pipeline appeared first on Education Next.

[NDN/ccn/comedia Links]

News…. browse around here

Best Shortlink Creator

check this out

Monday, July 26, 2021

The Education Exchange: Abolish School Districts, a New Book Proposes

The 44th Justice of the Arizona Supreme Court, Clint Bolick, joins Paul E. Peterson to discuss Justice Bolick’s book new book, “Unshackled: Freeing America’s K–12 Education System,” co-written with Kate J. Hardiman.


Sign up for the Education Next Weekly to receive stories like this one in your inbox
.


The post The Education Exchange: Abolish School Districts, a New Book Proposes appeared first on Education Next.

By: Education Next
Title: The Education Exchange: Abolish School Districts, a New Book Proposes
Sourced From: www.educationnext.org/the-education-exchange-abolish-school-districts-a-new-book-proposes/?utm_source=The%2BEducation%2BExchange%253A%2BAbolish%2BSchool%2BDistricts%252C%2Ba%2BNew%2BBook%2BProposes&utm_medium=RSS&utm_campaign=RSS%2BReader
Published Date: Mon, 26 Jul 2021 09:00:55 +0000

News…. browse around here

Best Shortlink Creator

check out here

Sunday, July 25, 2021

Joe Biden Grassroots Event with Terry McAuliffe and Virginia Democrats

Terry McAuliffe is running for governor of Virginia to create good-paying jobs, make health care more affordable, and give every child a world-class education. Tune in for our grassroots event.

News…. browse around here

Best Shortlink Creator

check out your url


Friday, July 23, 2021

Billionaires are in outer space while the working class struggles on Earth.

The richest guys in the world are off in space. They’re not particularly worried about Earth anymore. The days of them not paying a nickel in federal income taxes are going to end, and we will finally invest in the long-neglected needs of America’s working families.

Join us at www.berniesanders.com!

News…. browse around here

Best Shortlink Creator

check here


Republicans are getting VERY NERVOUS!

The Republicans are very, very nervous, and I’ll tell you why that is. On virtually every proposal — from providing paid medical leave, to making child care in this country affordable, to making community college tuition-free — we have widespread support from the American people.

Join us at www.berniesanders.com!

News…. browse around here

Best Shortlink Creator

check here


Thursday, July 22, 2021

SEN. BERNIE SANDERS & REP. PRAMILA JAYAPAL INSTAGRAM LIVE (12:30PM ET)

Join Rep. Pramila Jayapal and me NOW on Instagram to discuss how the budget bill is going to transform the lives of millions of working class Americans. The stakes could not be higher.

News…. browse around here

Best Shortlink Creator

check out here


Wednesday, July 21, 2021

Math Concepts? Or Procedures? Best Answer Is Teaching Both

I read with some dismay the response by Barry Garelick (“What It Takes to Actually Improve Math Education”) to Rick Hess’s interview with Andrew Coulson (“The Case for Game-Based Math Learning”).

Garelick unfortunately sets up a straw-dog contest between learning conceptual knowledge or procedural knowledge in mathematics learning. There is clear evidence that both are important and that they support each other, including in one paper Garelick cites, and in the classic book, Conceptual and Procedural Knowledge, edited by James Hiebert, published in 1986. The 2001 book, Adding It Up, written by the Committee on Mathematics Learning, established by the National Research Council, widely cited in our field, reported on five strands of mathematical   proficiency. One of those is procedural fluency. These classics underlie most contemporary views of mathematics education, including advice to teachers. Suffice it to say, almost no mathematics educator would deny deep connections between the two strands of knowledge, though there are differences of opinion on which should lead and when.

Consider the problem of developing procedural and conceptual understanding of division. An algorithm commonly taught, even mandated in many state standards for mathematics, is long division. Almost anyone who has completed a worksheet of twenty long division problems can tell you that practicing procedures alone does not miraculously result in a conceptual understanding of division. The more-complex-than-you-might-think concepts bundled together with understanding the algorithm include the role of the divisor and the dividend in getting the result, models for division, when division applies in solving real-world problems, interpreting quotients that are expressed as decimals fractions, and the role of place value and our base ten number system in carrying out the division algorithm. These aspects of the concepts of division are underpinnings that any students continuing in STEM education and careers must know and be able to use.

The role of instruction in helping students develop a multi-faceted view of division is clear. This instruction is very purposeful and the resulting knowledge useful.  What might that instruction look like? A rich task (not a bad term) is justifying that the long-division algorithm really works for any two rational numbers. There are many ways to do it, and many of these are accessible to youth. Comparing alternative algorithms, invented or otherwise, is an important strategy for developing understanding and a justification of why either works all the time. This kind of comparison is a “generic” skill worth teaching. When student engage in this kind of activity—justifying—they are legitimately participating in a practice that almost every mathematician does: creating an argument, or proof, for a given conjecture. (In this case, that the long-division algorithm works every time.) When students do this work, they are engaging in authentic mathematics (another term Garelick disparages). And not surprisingly, they must grapple with the conceptual aspects of division I note above.

My colleagues and I have written a book for teachers, Mathematical Argumentation in Middle School, published by Corwin, in which we provide an organized, rigorous approach to bringing this practice of professional mathematicians to the middle school classroom. It is based on a dozen years of research doing just that. We think it is worth a read for anyone who wants to break free of the conceptual/procedural tug of war.

Jennifer Knudsen is a senior mathematics educator at TERC.


Sign up for the Education Next Weekly to receive stories like this one in your inbox
.


The post Math Concepts? Or Procedures? Best Answer Is Teaching Both appeared first on Education Next.

[NDN/ccn/comedia Links]

News…. browse around here

Best Shortlink Creator

check this out

Tuesday, July 20, 2021

Big Data on Campus

Anyone who uses a smartphone or shops online has had their habits tracked, click by telling click. Big companies comb through that data to find patterns in human behavior and to understand, anticipate, and offer up goods and services we are most likely to purchase. Through predictive analytics, they identify trends and forecast our future choices.

This high-tech data crunch has become increasingly common in higher education, too. Colleges and universities are facing mounting pressure to raise completion rates and have embraced predictive analytics to identify which students are at risk of failing courses or dropping out. An estimated 1,400 institutions nationwide have invested in predictive analytics technology, with spending estimated in the hundreds of millions of dollars. Colleges and universities use these analyses to identify at-risk students who may benefit from additional support.

How accurate and stable are those predictions? In most cases, college researchers and administrators don’t know. Most machine-learning models used in higher education are proprietary and operated by private companies that provide little, if any, transparency about the underlying data structure or modeling they use. Different models could vary substantially in their accuracy, and the use of predictive analytics could lead institutions to intervene disproportionately with students from underrepresented backgrounds. It’s also not clear whether these expensive services and complex models do a better job of identifying at-risk students than simpler statistical techniques that take significantly less time and expertise to implement and that institutions therefore may be able to implement on their own.

We put six predictive models to the test to gain a fuller understanding of how they work and the tradeoffs between simpler versus more complex approaches. We also investigated different approaches to sample and variable construction to see how data selection and model selection work together. Our study uses detailed student data from the Virginia Community College System to investigate whether models accurately predict whether a student does or does not graduate with a college-level credential within six years of entering school. Using these same models, we also examine, for a given student, whether their predicted risk of dropping out is the same from one model to the next.

Table: Six Analytic ModelsWe find that complex machine-learning models aren’t necessarily better at predicting students’ future outcomes than simpler statistical techniques. The decisions analysts make about how they structure a data sample and which predictors they include are more critical to model performance. For instance, models perform better when we include predictors that measure students’ academic performance during a specific semester or term than when we include only cumulative measures of performance.

Perhaps most importantly, we find that the dropout risk predictions assigned to a given student are not stable across models. Where students fall in the distribution of predicted risk varies meaningfully from one model to the next. This volatility is particularly pronounced when we use more complex machine-learning models to generate predictions, as those approaches are more sensitive to which predictors are included in the models and which students and institutions are included in the sample. For example, among the students considered at high risk of dropping out based on predictions generated from a linear regression model, just 60 percent were also deemed high risk according to a popular machine-learning prediction algorithm called XGBoost.

Finally, we show that students from underrepresented groups, such as Black students, have a lower predicted probability of graduating than students from other groups. While this could potentially lead underrepresented students to receive additional support, the experience of being labeled “at risk” could exacerbate concerns these students may already have about their potential for success in college. Addressing this potential hazard is not as straightforward as just removing demographic predictors from predictive models, which we find has no effect on model performance. The most influential predictors of college completion, such as semester-level GPA and credits earned, are correlated with group membership, owing to longstanding inequities in the educational system.

Our findings raise important questions for institutions and policymakers about the value of investments in predictive analytics. Are institutions getting sufficient value from private analytics firms that market the sophisticated models? Even more fundamentally, since a primary goal of predictive analytics is to target individual students with interventions to keep them on track to completion, how reliable are these methods if a student’s predicted risk is sensitive to the particular model used? Colleges and universities should critically evaluate what they are getting for their investment in predictive analytics, which one estimate puts at $300,000 per institution per year, as well as the equity implications of labeling large proportions of underrepresented students as being “at risk.”

Who Goes on to Graduate?

The predictive analytics boom has coincided with growing pressure on colleges and universities to raise completion rates. About two thirds of U.S. states now use performance-based funding, which bases a school’s annual state aid amount on the outcomes of its students, not the size of its enrollment. Meanwhile, students are borrowing record amounts of money to fund their postsecondary education, and loan default rates are highest among students who drop out before finishing their degree.

Institutions have turned to predictive analytics to determine which students are most at risk of dropping out and to more efficiently steer advising and other interventions toward students identified as needing help. Such resources are relatively scarce after a decade-long decline in higher education funding—particularly at the non-elite, broad-access colleges and universities where most lower-income and underrepresented students enroll. If predictive analytics perform as intended, institutions can more effectively and efficiently target resources for the students who need them most.

For that to work, predictions must be accurate. We tested six models to see which do a better job of assessing student risk and which sorts of decisions we could make along the way to make models more or less accurate. These include three models that are commonly used by researchers due to their ease of implementation and interpretation: Ordinary Least Squares, Logistic Regression, and Cox Proportional Hazard Survival Analysis. We also tested three more complex and computationally demanding models: Random Forest and XGBoost, which both use decision-tree learning as the building block to predict outcomes, and Recurrent Neural Networks, which applies layers of intricate patterns overtop one another to model complex relationships between data inputs and outcomes.

We test these models using detailed data for 331,254 community college students in Virginia, all of whom initially enrolled between summer 2007 and summer 2012 as degree-seeking, non-dual-enrollment students. We focus on predicting “graduation,” which we define as the probability that a student completes any college-level credential within six years. Some 34 percent of students in our sample graduated within six years, either from a community college or a four-year school. This rich dataset includes hundreds of potential predictors, including student characteristics, academic history and performance, and financial aid information, among others.

We observe each student’s information for the entire six-year window after the term when they initially enroll. While in all of our models we use the full six years of data to construct the outcome measure, we test two different approaches to constructing model predictors.

Choosing the Student Sample. First, we construct a sample using all information from initial enrollment through one of two concluding events: either the term when the student first earned a college-level credential or the end of the six-year window, whichever comes first. As an alternative approach, we constructed a randomly truncated sample of students so the distribution of enrollment spells in the model-building sample matches the distribution for currently enrolled students.

Choosing Predictor Variables. Second, we investigate how using more and less complex predictors affects model performance. First, we test models that use simple data points like race and ethnicity, parental education, cumulative GPA, and the number of courses completed. Then, we use those same models but supplement the simple variables with more complex predictors, such as measures of students’ enrollment at institutions outside the Virginia community college system.

We then test how model performance is affected by the inclusion of predictors whose values vary over time. We include both simple term-specific predictors like GPA or credits attempted and separately test the inclusion of complex term-specific predictors, like how academically demanding students’ courses are in a given semester and the trajectory of students’ academic performance over time. Our overall aim is to compare how model accuracy varies based on our choices of sample and predictor construction and modeling method.

Our primary measure of model accuracy is the c-statistic, also known as concordance value. This “goodness of fit” measure determines whether a model is, in fact, predictive of the outcome of interest. In our study, the c-statistic assesses whether a randomly selected student who actually graduated has a higher predicted score than a randomly selected student who did not. A c-statistic of 0.5 indicates that the prediction is no better than random chance, while a value of 1.0 indicates that the model perfectly identifies students who will graduate. The higher the score, the better; often, a c-statistic value of 0.8 or above is used to identify a well-performing model.
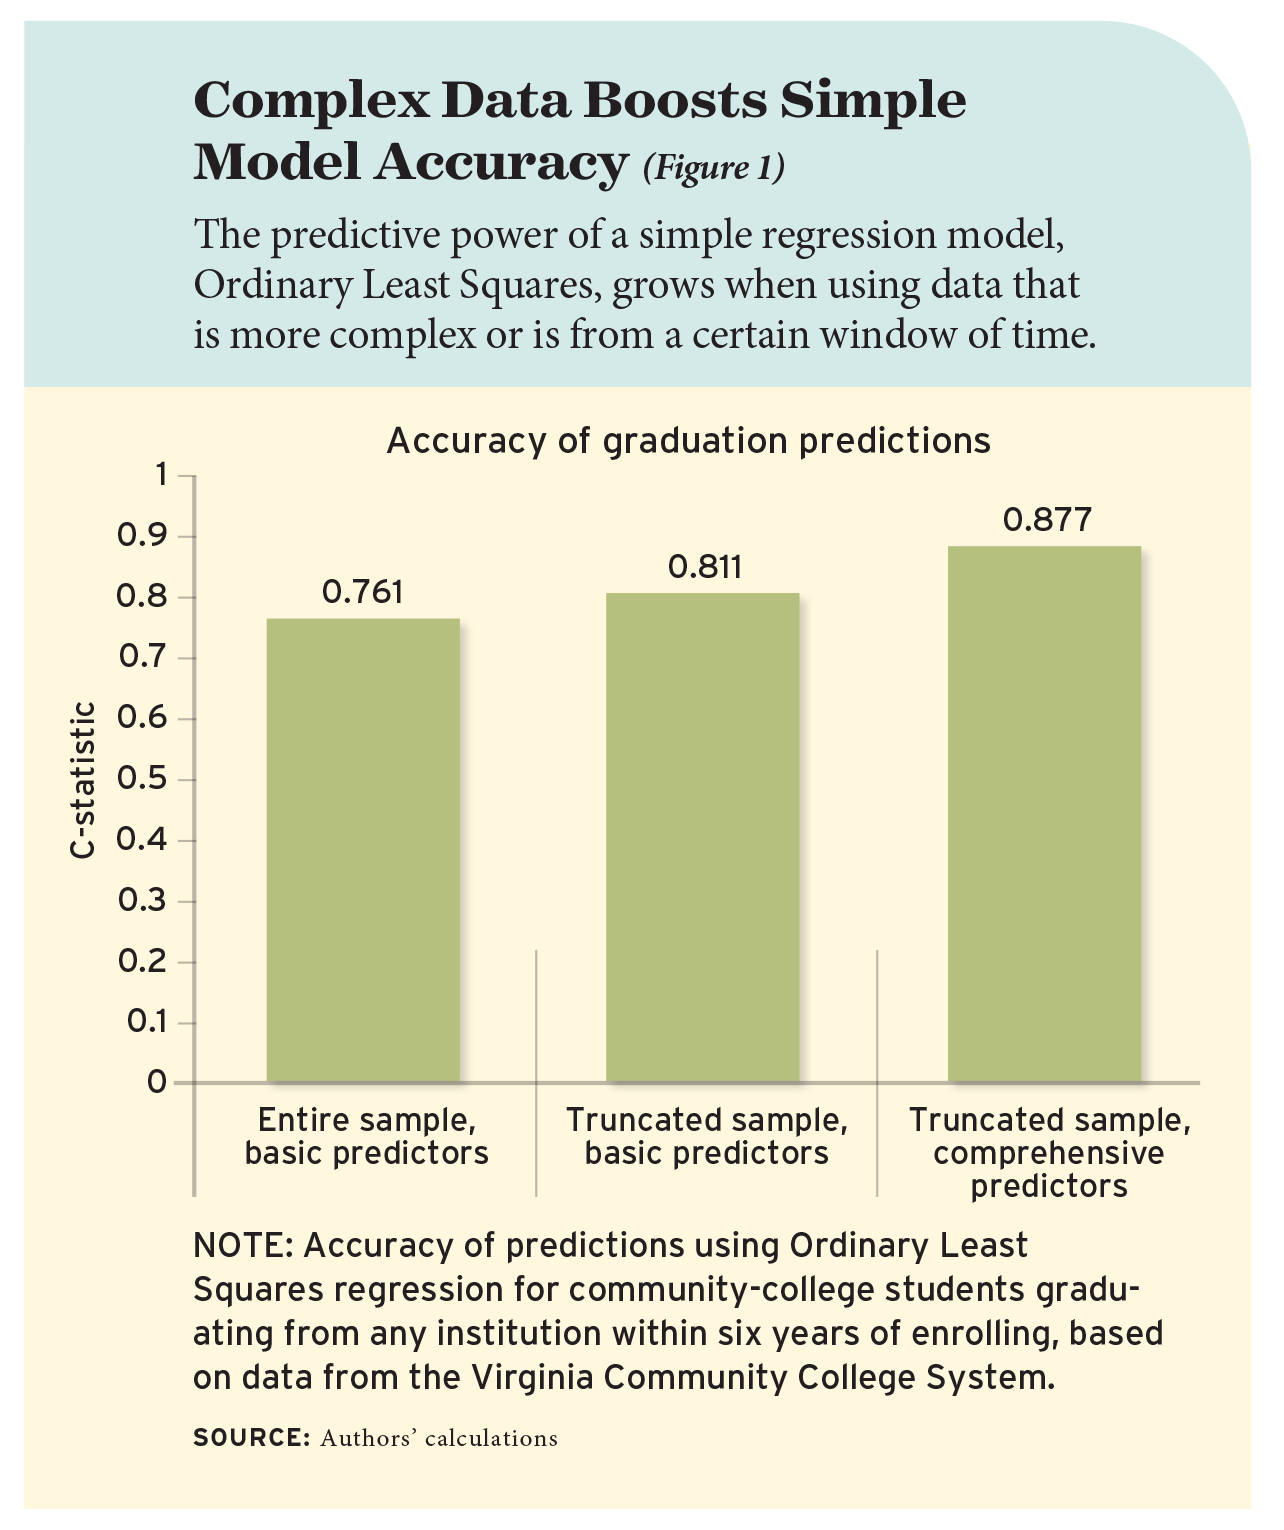
Figure 1: Complex Data Boosts Simple Model Accuracy

Predictions versus Reality

Our analysis finds that it is possible to achieve strong model performance with a simple modeling approach, such as Ordinary Least Squares regression. However, doing so requires thoughtful approaches to sample and predictor construction. Alternatively, it is possible to achieve strong performance with basic predictors, but doing so requires more sophisticated modeling approaches.

Using the relatively simple Ordinary Least Squares model as a baseline, we look closely at the improved accuracy of predictions made using more or less complex sampling and data selection (see Figure 1). Applying Ordinary Least Squares to the entire sample results in a c-statistic value of 0.76. That grows to 0.81 when using the sample that is “truncated” to be more representative of currently enrolled students with respect to their time enrolled in college and 0.88 when also including more comprehensive predictors.
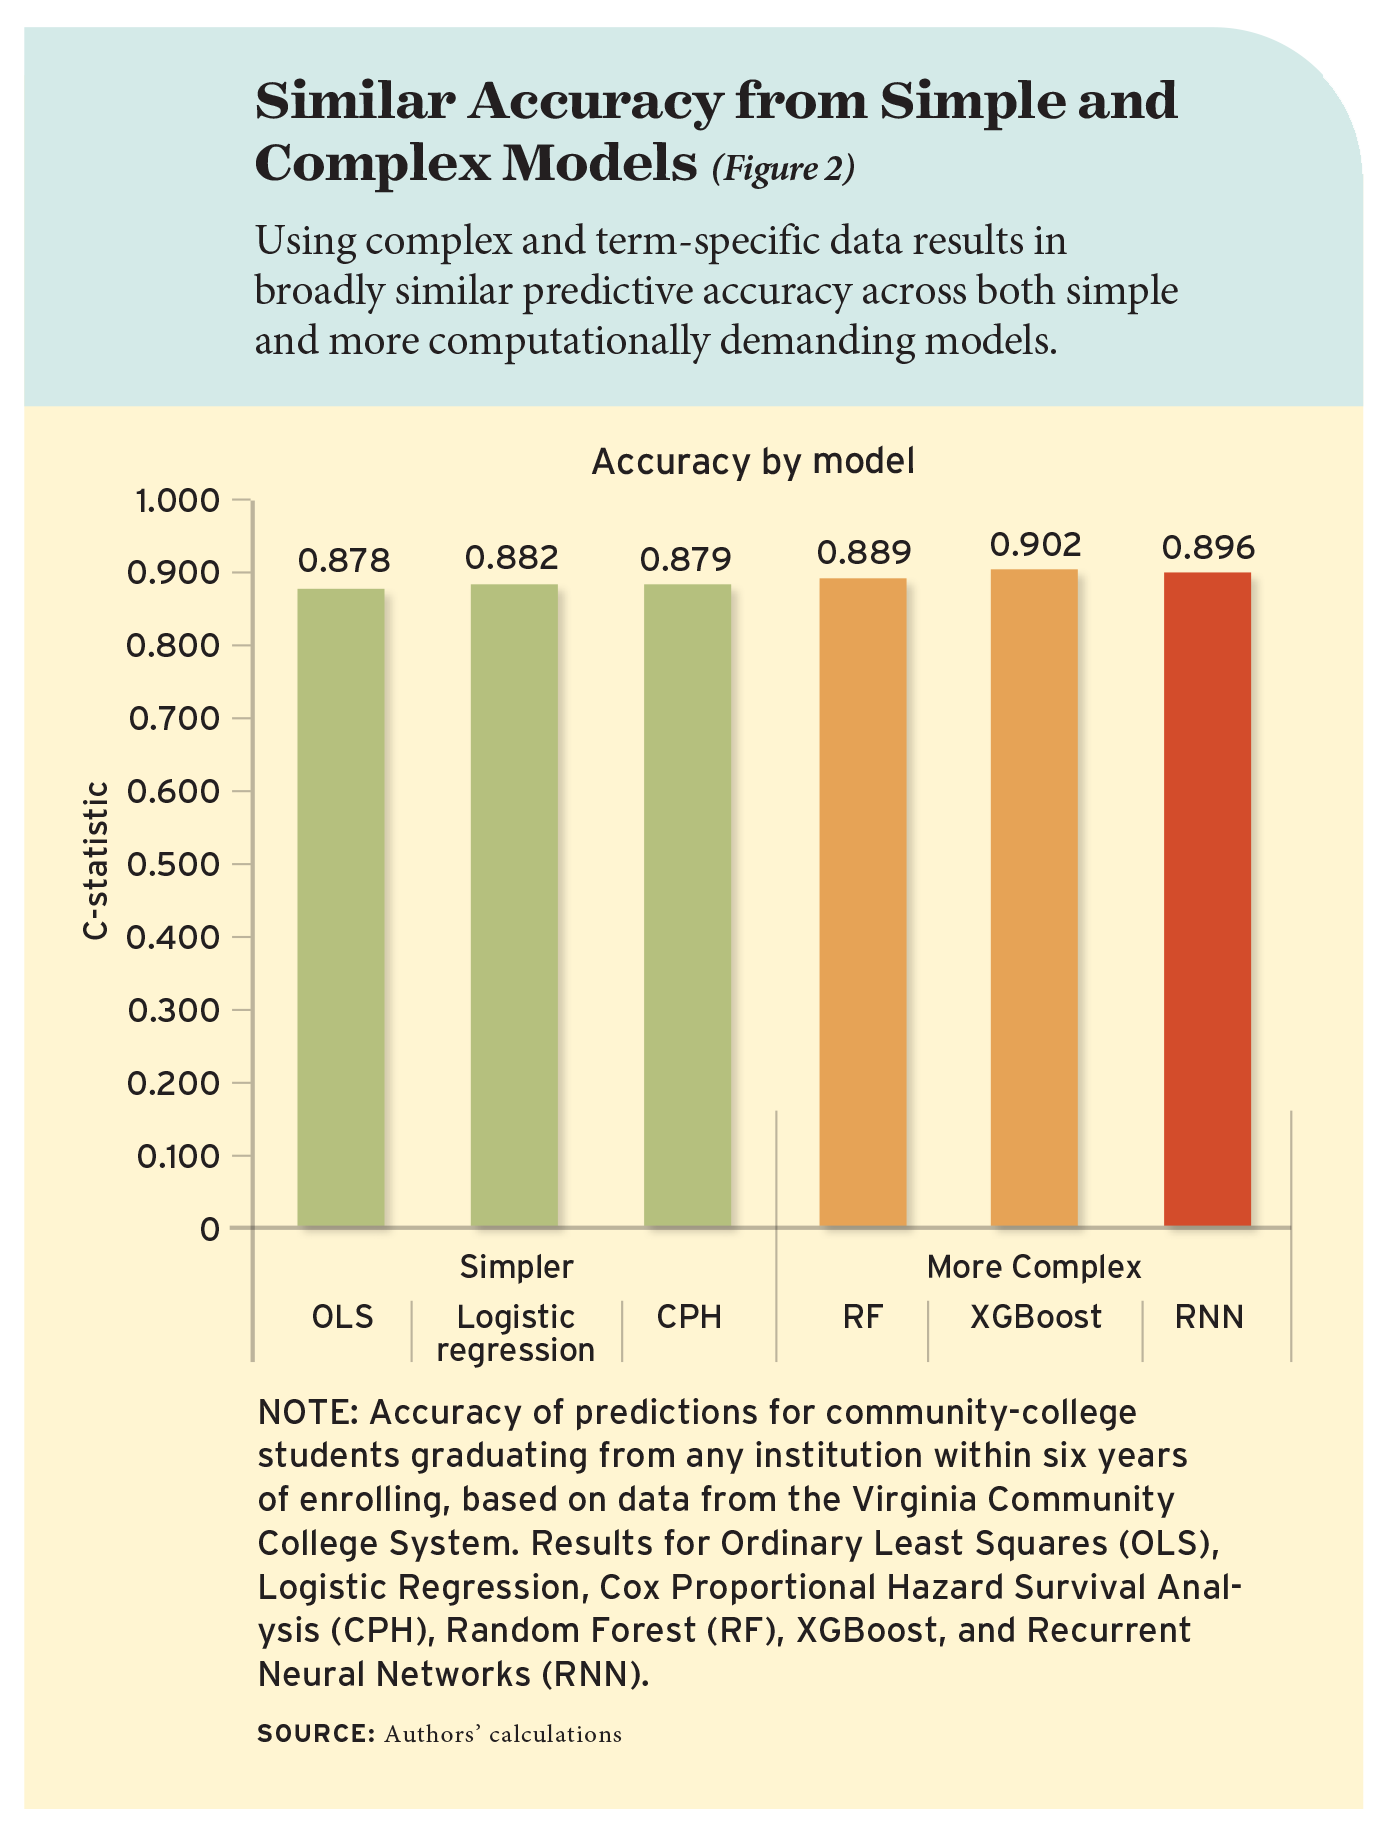
Figure 2: Similar Accuracy Models From Simple and Complex Models

We apply the same truncated sample and set of comprehensive predictors to five additional modeling approaches to document the gains in accuracy from using more complex prediction algorithms (see Figure 2). The c-statistics are similar across the six models, ranging from 0.88 for the Ordinary Least Squares model to 0.90 for the more complex, tree-based XGBoost model. These fairly high values are not particularly surprising, given both the large sample size and detailed information we observe about students in the sample, but the fact that a basic model has nearly as high a score as a more complex model is notable.

To put this result in context, Figure 3 shows the number of students at a prototypical community college expected to be assigned a correct prediction across the different models we tested. Out of 33,000 students, Ordinary Least Squares would correctly predict the graduation outcomes of 27,119, or 82 percent. Three models perform a bit better: Logistic Regression, XGBoost, and Recurrent Neural Networks. XGBoost is the best-performing model and would correctly predict graduation outcomes for 681 more students than Ordinary Least Squares, a 2.1 percent gain in accuracy. The most computationally intensive model, Recurrent Neural Networks, presents the smallest gain over Ordinary Least Squares and would correctly predict outcomes for an additional 287 students.

Figure 3: Correct Predictions at a Typical Community College

A Question of Risk

One of the main purposes of predictive analytics is to identify at-risk students who may benefit from additional intervention. In predicting the likelihood of graduation for all students in our sample, each model also generates for each student a “risk ranking”—for example, that the student is at the 90th percentile among all students in terms of the probability of earning a degree. The higher the percentile value, the more likely a student is predicted to graduate relative to their peers. Students assigned lower predicted probabilities are therefore deemed at higher risk of dropout.

Colleges and universities may vary in which students they target for proactive outreach and intervention along the distribution of predicted risk. Some colleges may take the approach of targeting students at highest risk, while others may focus on students with more moderate predicted risk if they consider those students more responsive to intervention.

This raises a question about the relative accuracy of risk rankings. Regardless of where along the risk spectrum institutions choose to focus their attention, a desirable property is that different modeling strategies assign students similar risk rankings. How consistent are these rankings in practice from model to model?

We pair models together to compare where a student’s relative risk ranking falls. We divide the risk distribution into 10 equal groups, or deciles, and observe the extent to which students are assigned to different deciles across the two modeling approaches. For instance, among students whose predicted values from the Ordinary Least Squares model place them in the bottom 10 percent in terms of likelihood of graduation, we examine what percentage of those students are also assigned to the bottom 10 percent in the two other simple models. Some 86 percent of students in the bottom 10 percent based on Ordinary Least Squares are also in the bottom 10 percent from Logistic Regression. The same rate of consistency occurs between Logistic Regression and the third conventional model, Cox Proportional Hazard Survival Analysis.

However, discrepancies are more pronounced across all other model pairs. For example, half of students in the bottom 10 percent based on predictions from the tree-based Random Forest model are assigned to a different decile by the Recurrent Neural Network algorithm. We find even larger inconsistencies across models when considering students with lower predicted levels of risk. For example, across all model pairs, fewer than 70 percent of students assigned a risk rating in the third decile by one model were in that same decile by the other model.

If resource constraints prohibit colleges from intervening with all students predicted not to graduate, this instability in risk rankings means that the particular method of prediction used can significantly impact which students are targeted for additional outreach and support.

More Predicted Risk for Underrepresented Students

One common concern is that using predictive modeling in education may reinforce bias against subgroups with historically lower levels of academic achievement or attainment. In our sample, many historically disadvantaged groups—including Black and Hispanic students, Pell recipients, first-generation college goers, and older students—have significantly lower graduation rates than their more advantaged peers. At a conceptual level, including these types of demographic characteristics in predictive models could result in these subgroups being assigned a lower predicted probability of graduation, even when members of those groups are academically and otherwise identical to students from more privileged backgrounds.

This would likely result in students from disadvantaged groups being more likely to be identified as at-risk and provided additional supports. To be sure, if available interventions are effective, such identification could be a good thing. However, being flagged as “at risk” could be detrimental if it compromises students’ sense of belonging on campus, which is an important contributor to college persistence and success.

We examine how excluding demographic predictors affects model performance and student-specific risk rankings. It’s an intuitive approach to addressing this concern: without including demographics in predictive models, researchers and administrators might assume that students’ predicted outcomes would not vary by race, age, gender, or income. Furthermore, some state higher education systems and individual colleges and universities face legal obstacles or political opposition to including certain demographic characteristics in predictive models.

We compare the c-statistic values of models that include demographic characteristics to models that exclude this information and find their accuracy virtually unchanged. This occurs because many of the non-demographic predictors that remain in the model, such as cumulative GPA, are highly correlated with both student demographic characteristics and the probability of graduation. For example, Black students have a cumulative GPA of 2.13, on average, a half-grade lower than the 2.63 average of non-Black students. Even when race is not incorporated into prediction models explicitly, the results still reflect the factors that drive race-based differences in educational attainment. Institutions are therefore more likely to identify students of color as being at risk when using predictive analytics.

Questions to Consider

We believe there is a broad set of questions that are important for colleges and universities to consider when making decisions about using predictive analytics.

First, do the benefits of predictive modeling outweigh the costs? A back-of-the-envelope calculation can put this cost-benefit question in context. We find that using a more advanced prediction method like XGBoost would correctly identify graduation outcomes for an additional 681 students at a prototypical large community college that enrolls 33,000, compared to Ordinary Least Squares. If the cost to purchase proprietary predictive modeling services is estimated at $300,000, this implies an average cost per additional correctly identified at-risk student of $4,688. What other ways could institutions spend that money to boost completion rates? Are the potential benefits from sophisticated predictive analytics likely to be greater than those other investments?

Second, the instability in students’ relative risk ranking across models calls into question how strongly colleges should be relying on the “dropout risk” designation. In practical terms, this instability means that a student who is at substantial risk of dropping out may not get targeted for intervention, or a student who is predicted to have a higher probability of completion may get support they do not need. We encourage colleges and universities to advocate for greater transparency from their predictive analytics providers about the sensitivity of students’ relative risk rankings to different modeling choices. Choosing which prediction model to use may therefore depend, in part, on multiple factors, such as the intervention a college is developing, which set of students the college wants to target, and how closely the profile of students identified by a set of candidate prediction models comes to the target profile of students for intervention.

Third, students from underrepresented groups are likely to be ranked as less likely to graduate, regardless of whether demographic measures are included in the models. On the positive side, this could lead to institutions investing greater resources to improve outcomes for traditionally disadvantaged populations. But there is also the potential that outreach to underrepresented students could have unintended consequences, such as reinforcing anxieties students have about whether they belong at the institution. Colleges should weigh these considerations carefully.

Fourth, we see potential hazards regarding privacy and whether students are aware of and would consent to these uses of data. For instance, researchers at the University of Arizona constructed an experiment using machine learning to predict whether students dropped out before earning a degree with up to 90 percent accuracy based on their levels of campus engagement within the first few weeks of school. The source data: student ID swipes, which tracked their movements across campus—when they left their dorm rooms, checked out library books, or even bought a coffee. While this sort of data-gathering could have the potential to improve model accuracy, it also raises important privacy questions that higher education administrators need to actively consider.

A final question is whether predictive analytics is actually enabling more effective identification and support for at-risk students. Few studies to date have rigorously examined the effects of predictive analytics on college academic performance, persistence, and degree attainment; the few that do find limited evidence of positive effects.

However, it is easy to conflate the accuracy of predictive modeling with the efficacy of interventions built around its use. It could be that predictive models convey limited information about students, but it also may be the case that the resulting interventions were ineffective. While predictive analytics is intended to provide answers, we see further questions ahead.

Kelli A. Bird is research assistant professor at the University of Virginia, where Benjamin L. Castleman is Newton and Rita Meyers Associate Professor in the Economics of Education and Yifeng Song is data scientist. Zachary Mabel is associate policy research scientist at the College Board.


Sign up for the Education Next Weekly to receive stories like this one in your inbox
.


The post Big Data on Campus appeared first on Education Next.

By: Kelli A. Bird
Title: Big Data on Campus
Sourced From: www.educationnext.org/big-data-on-campus-putting-predictive-analytics-to-the-test/?utm_source=Big%2BData%2Bon%2BCampus&utm_medium=RSS&utm_campaign=RSS%2BReader
Published Date: Tue, 20 Jul 2021 09:00:34 +0000

News…. browse around here

Best Shortlink Creator

check over here